TL:DR:
A model of venture returns following a power law distribution, under reasonable assumptions, points in the direction of larger portfolios — at least 150 investments per fund.
This post explores some ideas about venture capital returns and portfolio size. It builds on other explorations including Jerry Neumann's and Seth Levine's. I wrote a simple simulator in a Google Colab notebook, which generated the graphs in this post. At the bottom you'll find a link to the notebook which you can also run or copy as a jumping off point for further exploration.
Jerry Neumann's posts explore the consequences of the idea that venture returns (the returns to investments in early stage, high growth potential companies) are not normally distributed, as public market returns are, but follow a power law distribution.
The first step is to look at the evidence that this might be so, and if so what are the approximate parameters of the distribution.
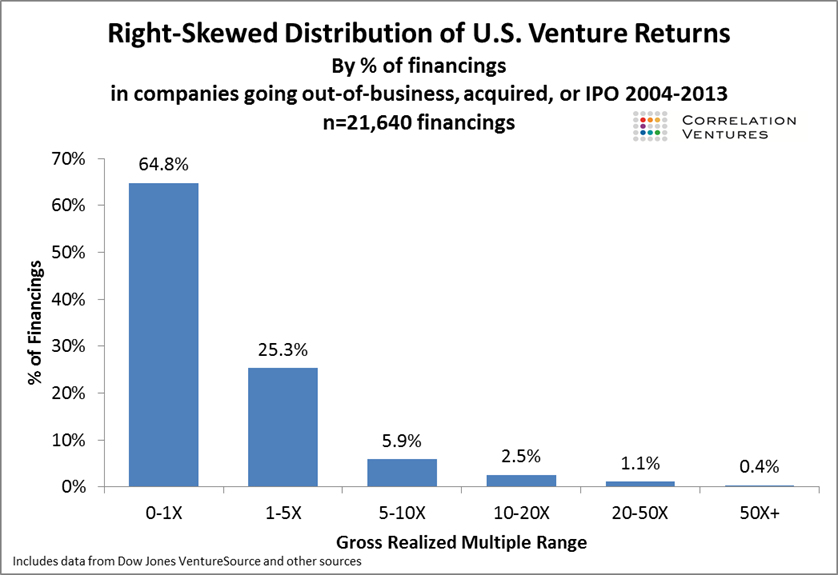
This graph is from Seth Levine's blog; the underlying data comes from Correlation Ventures, but I don't have access to the data itself.
A priori it looks as though it would be a good fit for a power law distribution.
(Sidebar: What is a Power Law distributon?)
In a power law distribution, an outcome's likelihood is inversely proportional to its size:
p(outcome) = C*outcome^-alpha
alpha is a parameter which governs the skew of outcomes (smaller alpha -> more skew -> more big outcomes)
Some evidence suggests alpha clusters around 2.
C is a constant multiplier parameterized by alpha and the minimum outcome:
C = (alpha-1)* (min_outcome)^(alpha-1)
One wrinkle with using a power law is that the minimum outcome can't be zero (even though it obviously can in venture). We'll come back to this later but in the meantime a minimum return of 0.35 together with an alpha of 2.0 seems to approximate the data. What this roughly means is that at the low end of outcomes, I'm averaging out zeros and very low outcomes so the minimum is a return of 0.35. Later I'll explore some alternatives such as having a fixed number of zeros, but the overall statistics will turn out quite similar.
I wrote some simple code to sample outcomes (multiples on invested capital) from the distribution. Then a histogram of 10,000 outcomes looks like this:
One wrinkle with using a power law is that the minimum outcome can't be zero (even though it obviously can in venture). We'll come back to this later but in the meantime a minimum return of 0.35 together with an alpha of 2.0 seems to approximate the data. What this roughly means is that at the low end of outcomes, I'm averaging out zeros and very low outcomes so the minimum is a return of 0.35. Later I'll explore some alternatives such as having a fixed number of zeros, but the overall statistics will turn out quite similar.
I wrote some simple code to sample outcomes (multiples on invested capital) from the distribution. Then a histogram of 10,000 outcomes looks like this:

Looks like it's in the right ballpark.
Then I ran monte carlo simulations of a large number of portfolios of different sizes, and looked at some of the metrics that come out. A monte carlo simulation is a fancy way of saying you take a lot of samples - in this case I created 1000 random portfolios each of size 5, 6, 7, 8, ... investments all the way up to 1000 portfolios of size 300.
As an example, here are the results of simulating 1000 portfolios, each with 100 investments in them. The portfolios are ordered from smallest to largest returns. The y-axis shows the overall return of each of the 1000 portfolios:

You can see that if you take 1000 random portfolios of this size, most have modest returns but a small number have very high returns. So I repeated this exercise at every portfolio size between 5 and 300, and then looked at some overall statistics.
The core thing we're interested in is, at each portfolio size, what are the chances of failing (returning < 1x), tripling, 5x-ing and 10x-ing the fund ?

So for this model:
- With just 5 investments in the portfolio, you have a more than 40% chance of losing money. This goes down rapidly until portfolios sizes between 100 and 150 when there's very little or zero chance (what this means is that none of the 1000 random portfolios at that size lost money).
- The chance of tripling the fund gently increases as you increase the portfolio size, though it starts to level out.
That's also reflected when you look at the minimum return of any of the 1000 portfolios at each size, which shows that after a size of about 150 investments per portfolio, no portfolio loses money, and the minimum keeps increasing. x-axis is portfolio size:

How about the means?:

Ouch. What's going on here ? Well the thing about power law distributions is that they have no maximum value (though values become increasingly rare as they get larger). When we created our sample portfolios we independently sampled sum(x=5->300) x*1000 companies which is over 45M independent companies. Occasionally you get a crazily large outcome, and that obscures the results making the mean harder to discern (those crazy outcomes have more of an effect on the smaller portfolios). I'll talk below about whether this is realistic, and what an alternative might look like.
Maybe the medians will give a better idea - 50% of the portfolios do as well or better than this:

Again, it looks like this continuously goes up, though the rate of improvement slows down, until at 300 investments the median portfolio is returning 2.6x.
Discussion
So all in all this model seems to show that the larger your portfolio, the better you're likely to do. Why should that be so? With a power law distribution of returns, success is all about hitting that rare outlier. Other things being equal, the more chances you have, the greater the chance of a big hit. I think we can do better than this simple model though.
- The model is very sensitive to changes in the value of alpha (lower alpha is better), though the overall trend that more investments are better is very consistent.
- I'd like to get hold of an actual historical dataset (rather than the summary statistics) and try to fit it, to see if we can understand some realistic ranges for alpha.
- The scenario is unrealistic in one important respect - it assumes each company in the 45M + draws is completely standalone, with only 1 investor. It's more realistic to say that there is a pool out there of funded companies, and investors are picking their investments from this pool. Separately I've done some modeling of that as well, and the trends are similar though the triple rate is a bit lower, depending on the size of the pool. I'll save that for a follow-on post.
- Anecdotal evidence suggest that the sector as a whole doesn't do as well as this model suggests - I'd like to get some historical data to examine that also. If it's true, it may be that alpha is too low, or the pooling effect may play a role.
- I've also experimented with various ways of dealing with the unrealistic positive minimum (such as zero-ing out returns below a threshold). Again, this tends to lower returns as you'd expect, but doesn't affect the trend.
- Finally, I looked at the concept of 'fund returners' by looking at the ratio of the returns for the single most successful investment, 1% of invested capital and 5% of invested capital, at each portfolio size:

Again this is quite consistent across different models and parameters. The single largest investment contributes a large proportion of the total fund at low portfolio sizes (half in this example) but even at larger sizes is still contributing almost 30%. The 1% and 5% ratios continue to grow through 300 - I will model them out to larger numbers and see where they get to.
Next post: pools, sampling effect.
Comments
Post a Comment